Acquisition Compass builds the cost of a new account from reported results for the 10 largest US card issuers, then sets it against 5 years of discounted contribution. Marketing, sign up incentives, identity verification and onboarding all sit inside the cost. Value assumptions hold steady across quarters, so every movement you see here is cost.
Spending does not always directly correlate to accounts acquired. And that gap is the story. Marketing rose 12.1% while accounts rose 5.8%, so the cost of an account moved up. 2 issuers moved the other way and lowered what an account costs them.
Each layer adds a real cash cost that an issuer carries to open an account. The published ratio uses the fourth layer, so the comparison holds across issuers with very different offer strategies.
Reported marketing and advertising expense allocated to consumer acquisition, divided by accounts opened in the quarter.
Adds the production and distribution cost that sits outside the media line, including direct mail, agency and creative.
Adds the sign up bonus, the intro rate give up and the cash offer. This is where offer rich strategies show their true cost.
Adds identity verification and onboarding fulfilment. This is the figure the published return is calculated on.
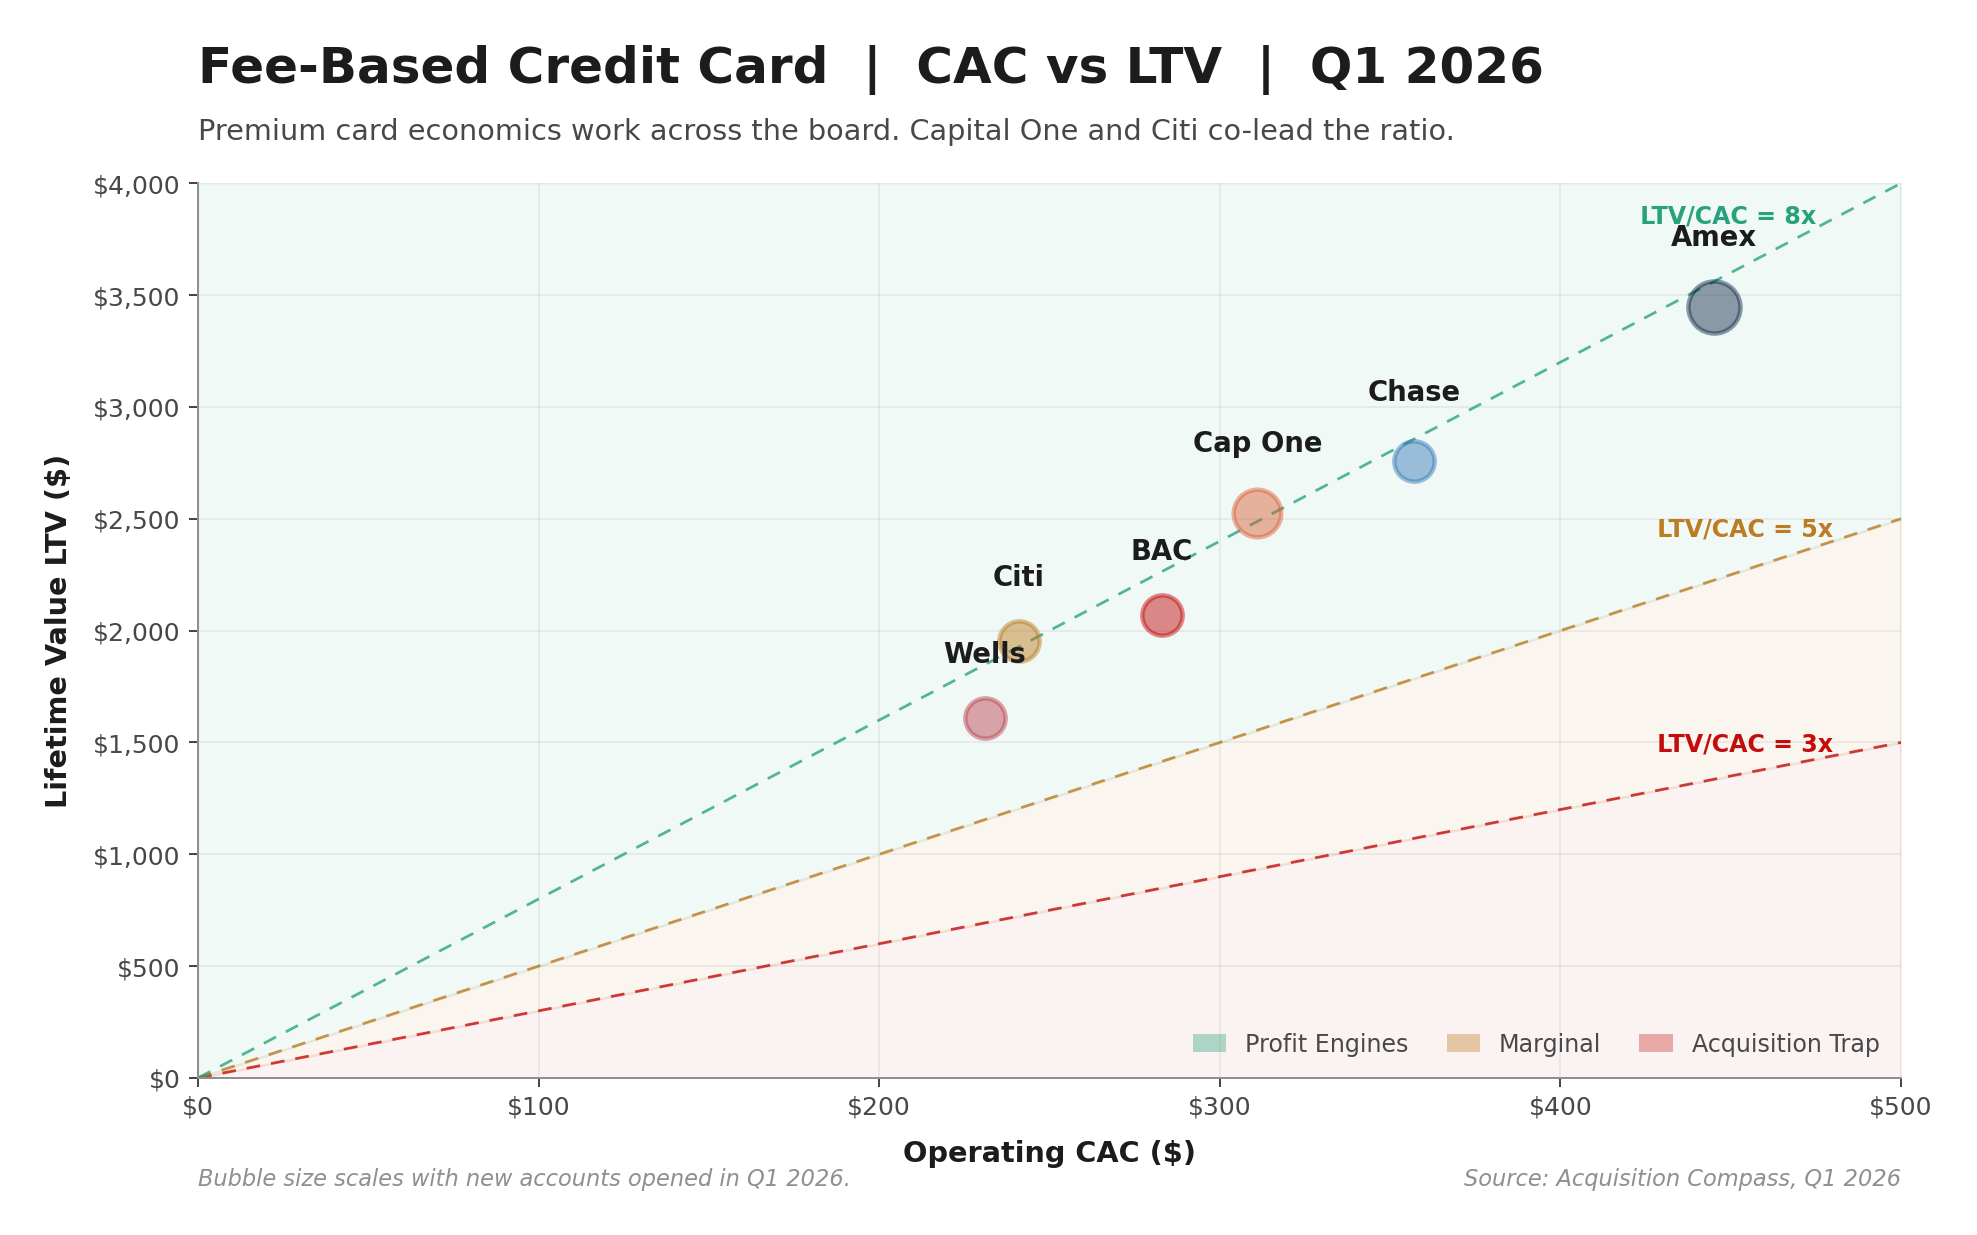
5 years of discounted contribution divided by what the account costs to open. Every fee based franchise clears 1.5x. Value assumptions are held steady throughout the year, so all movement reflects cost.
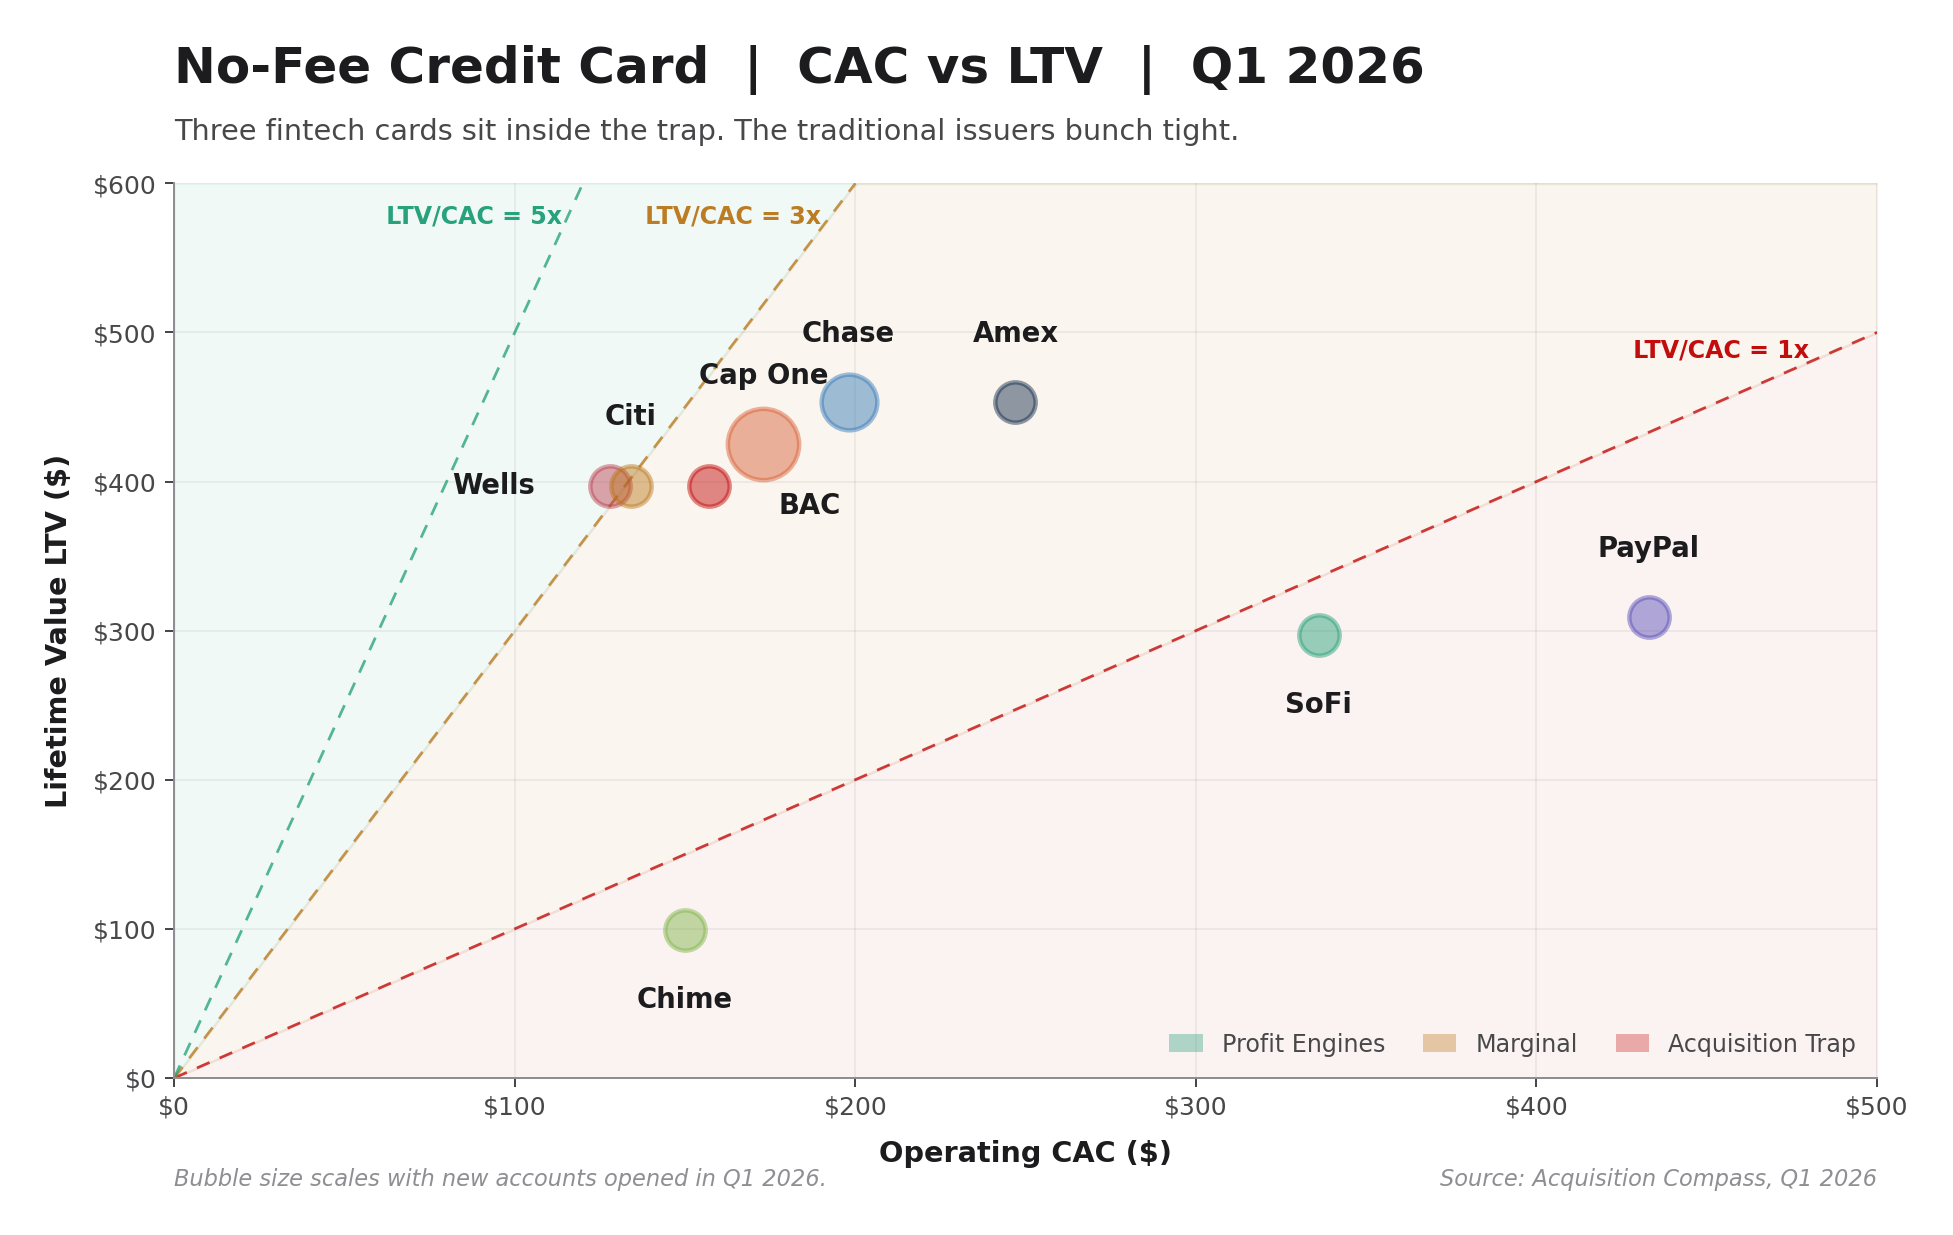
The no fee card earns its keep through the relationship it opens rather than through the card alone. Citi holds the widest margin in the panel, and Wells Fargo and U.S. Bank both improved this quarter.
| Issuer | Marketing Q1 | Marketing Q2 | Change | Cost Q1 | Cost Q2 | Change | Accounts Q1 | Accounts Q2 |
|---|---|---|---|---|---|---|---|---|
| JPMorgan Chase | 1,604 | 1,670 | +4.1% | $267 | $275 | +3.0% | 4,380 | 4,430 |
| Bank of America | 533 | 736 | +38.1% | $140 | $178 | +27.1% | 2,048 | 2,230 |
| Citigroup | 305 | 415 | +36.1% | $45 | $55 | +22.2% | 3,062 | 3,391 |
| Wells Fargo | 369 | 361 | -2.2% | $121 | $116 | -4.1% | 1,501 | 1,532 |
| American Express | 1,480 | 1,650 | +11.5% | $386 | $444 | +15.0% | 3,100 | 3,000 |
| Capital One | 1,497 | 1,661 | +11.0% | $274 | $278 | +1.5% | 4,771 | 5,221 |
| Synchrony Financial | 114 | 137 | +20.2% | $21 | $23 | +9.5% | 4,650 | 5,100 |
| U.S. Bancorp | 217 | 216 | -0.5% | $149 | $140 | -6.0% | 868 | 920 |
| PNC Financial Services | 87 | 110 | +26.4% | $106 | $133 | +25.5% | 428 | 430 |
| 9 reporting issuers | 6,205.8 | 6,955.8 | +12.1% | $184 | $193 | +5.2% | 24,808 | 26,255 |
Marketing in millions of dollars. Accounts in thousands. Cost per account in dollars, blended across cards, checking and small business deposits. The panel line is volume weighted rather than an average of the rows, because the middle issuer changes between quarters. Citi reports $283M of advertising and marketing and carries the rest of its acquisition cost inside revenue. Both quarters are on the same basis. Portfolio purchases and bank conversions sit outside every denominator, so the comparisons stay like for like.
Barclays US Consumer Bank
Barclays publishes first half results on 28 July 2026, so its second quarter figures are not yet public. It sits in the panel roster and outside every aggregate on this page. Barclays also publishes no United States marketing line at any level, so its numerator is built from segment operating expense and cross checked against a peer benchmark scaled by receivables.
When our acquisition spending rises, how much of the lift shows up in accounts opened, and how quickly does it show up?
What does the sign up incentive add to the cost of an account, and what does it add to the value of that account over 5 years?
Which products earn their acquisition investment back inside the first year, and which need the full 5 to get there?
Every input and every assumption is published with a confidence tier.
Open the methodology